Arthrex
JIMI Orthopedic Diagnostic System
Turning academic research into an investigational product
Understanding the domain
JIMI (Joint Instability Measurement Interface) began as a tool developed at a university in Japan to measure orthopedic range of motion in patients recovering from ACL surgery. At Pathfinder, Arthrex engaged us to advance to the next step of investigational use, building a full user experience around the proof-of-concept code.
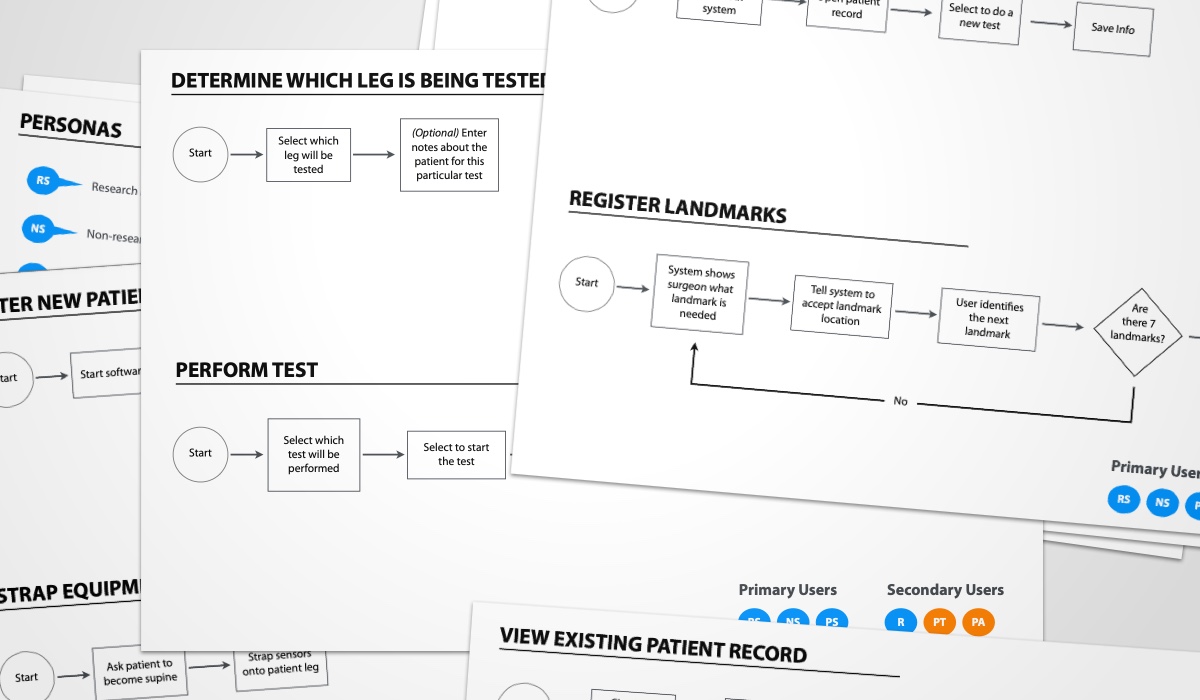
Together with the research lead on the project, I helped facilitate a workshop with our product owner on the client side to identify user personas. Working from the output of this session, I assembled a detailed set of nine personas including doctors, physical therapists, patients, and administrators. We were able to get fairly granular, distinguishing between research-focused surgeons and non-research-focused surgeons or adult and pediatric patients.

As a picture began to come together of the day-to-day process of doctors and physical therapists measuring patients’ range of motion, I started to define a set of user flows, tagged with corresponding personas. For the most part, these were all clinical workflows, though we also considered sales use cases where certain steps would have to be skippable.
As an investigational medical device, EMR integration was out of scope at this point in the product lifecycle. For this reason, on-device review and analysis was an important part of the use cases we needed to capture.
Making connections
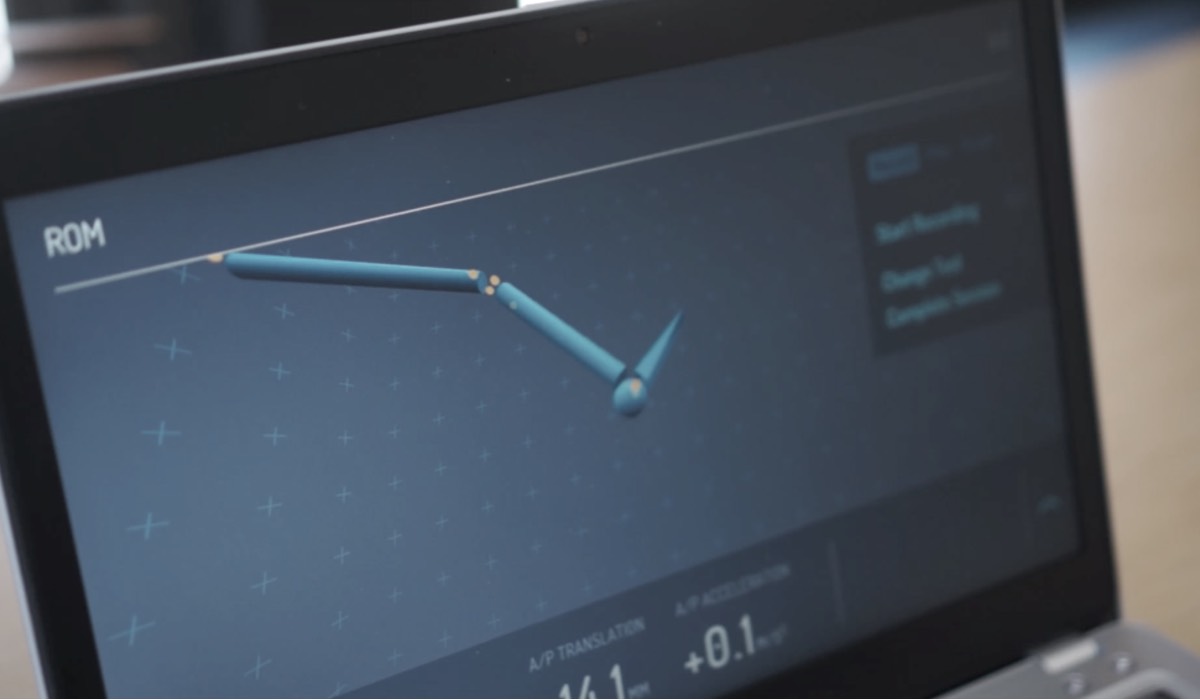
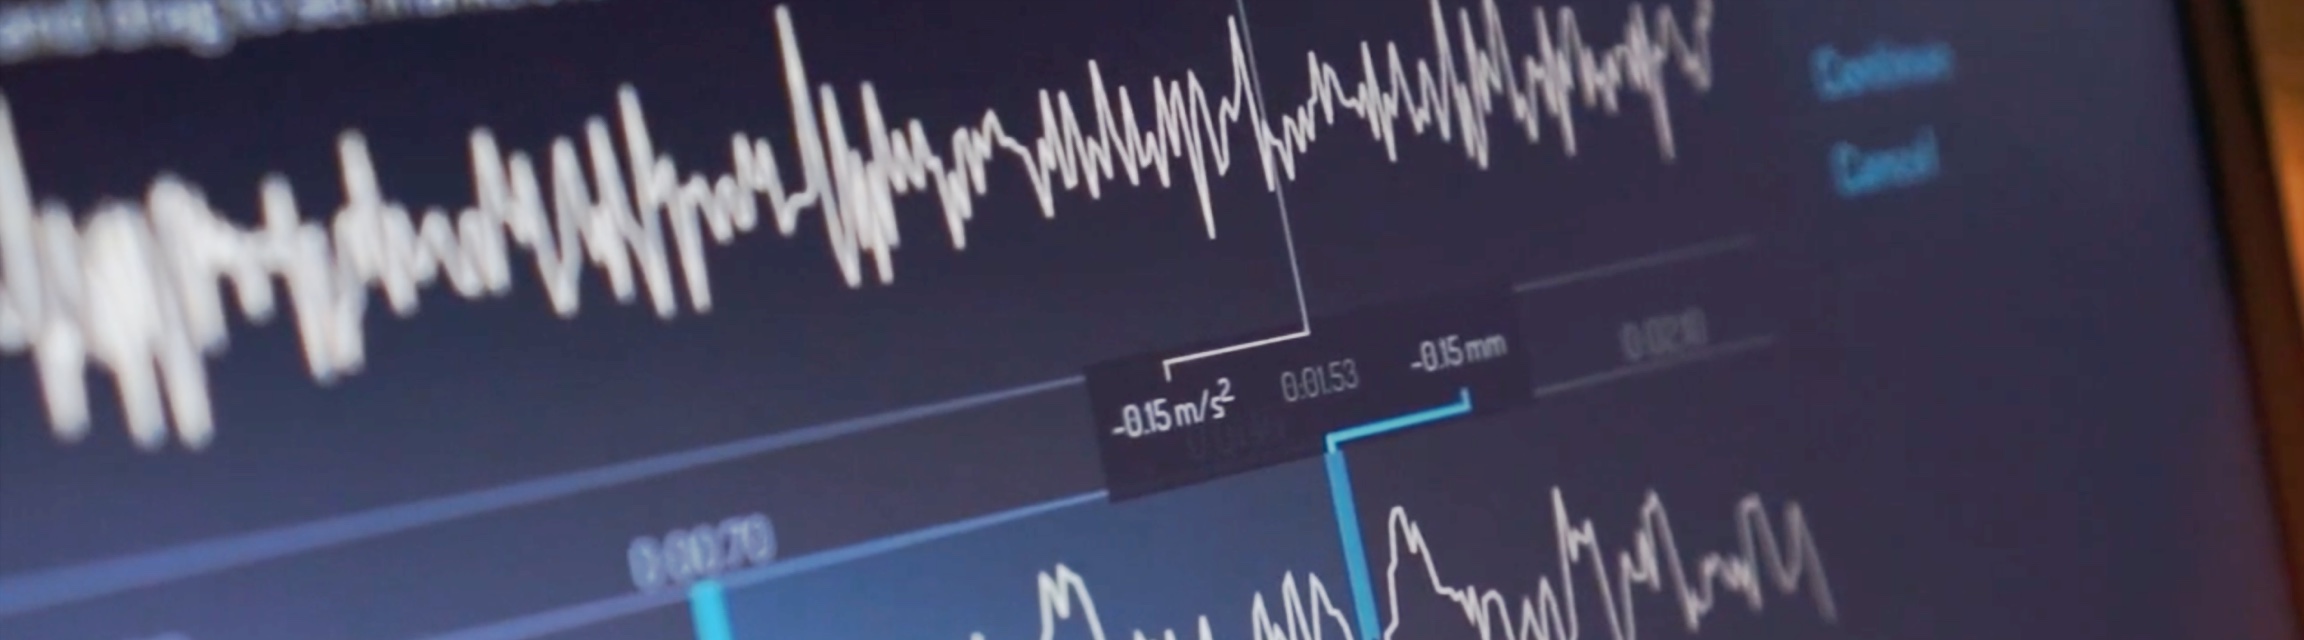
Two distinct use contexts began to coalesce: Measurement and review. The former required a guided setup for aiding clinicians in strapping on the measurement sensors and a real-time view of the sensors in 3D space, while the latter required the ability to dive into acceleration data to make clinical assessments.
I started wireframing at a very low level of fidelity, but, typical to my approach to wireframing, I also front-loaded some attention to visual hierarchy. My goals were to minimize the amount of potential distractions onscreen at any given time, allowing the clinician to focus on either the setup, measurement, or analysis tasks.
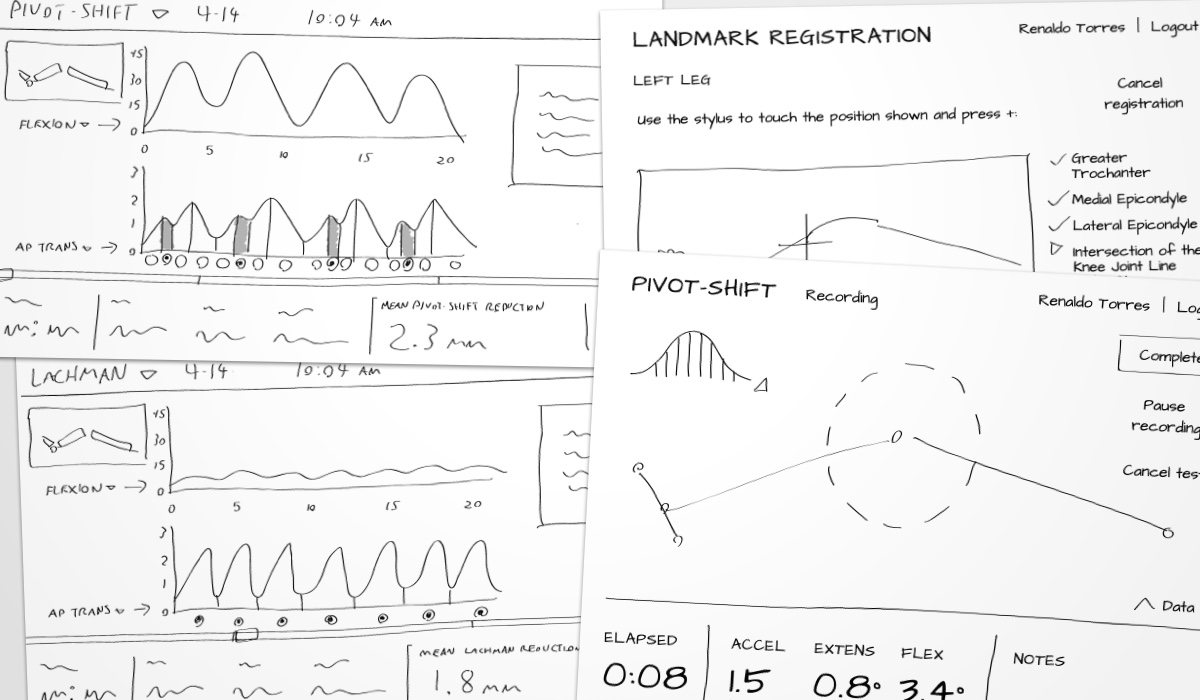
As the wireframes were validated with the product owner, I began to explore a visual design system for the UI. I selected a pair of type families: One a display family suited to real-time numeric displays and large type, the other a text family suited to directions, supporting text, and menus. These led into high-fidelity mockups of the UI, which led to the next phase of design and development: visuallizing data.
At this point, the engineers on the project had been investigating potential solutions for 3D rendering. Having established that the tech stack would be using embedded Chromium for the UI, they were leaning toward Three.js, and I started floating a few approaches to visualization to get a sense of how they would affect scope. An anatomically-detailed 3D leg was not considered as this would require complex inverse-kinematic rigging (and wouldn't necessarily reflect an actual patient's leg anyway), so I proposed a few different ways of abstracting the joints of the leg into a 3D model, ultimately taking a minimalist, geometric approach.
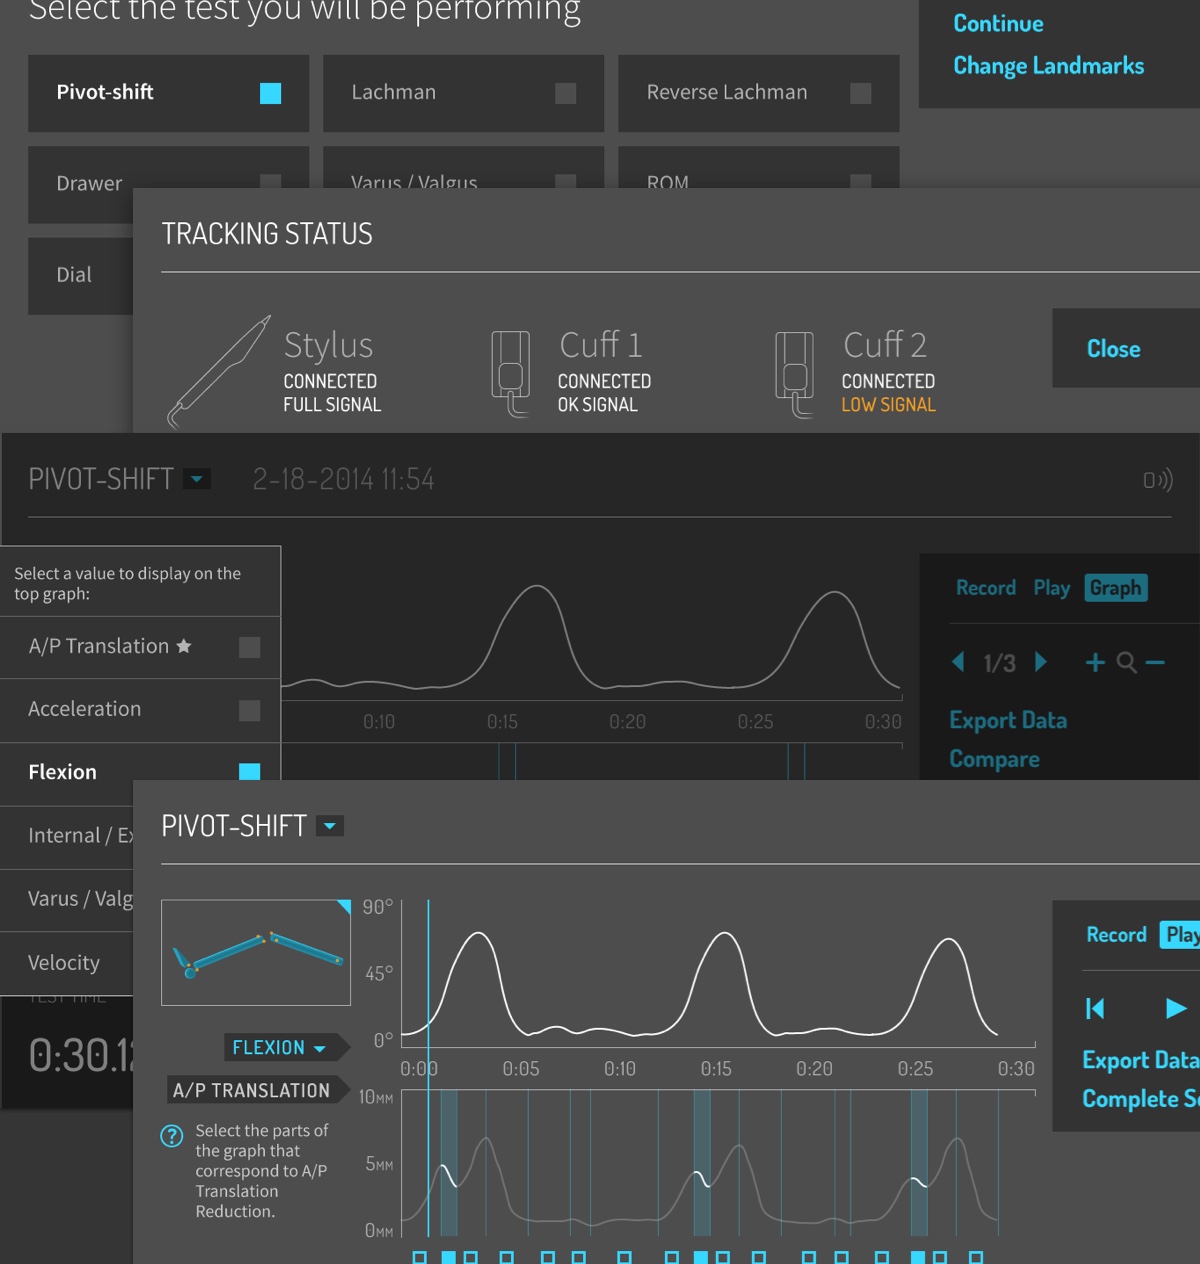
While the real-time view relied on 3D graphics, the analysis view would primarily consist of charts measuring values such as flexion or anterior/posterior translation of the joint. The core interaction in this view was to select slices of a graph to derive other measurements from them. To accommodate this kind of interaction, the engineers chose D3.js, and as with the 3D visuallization, we kept a close feedback loop as they implemented it.
Given the web-based UI stack and my familiarity with CSS, I actually roughed out the initial UI structure as a static, viewport-responsive (while this would only be used on laptop or desktop computers, we needed the window to be resizable) HTML page which the engineers then adapted into the UI.